ABSTRACT:

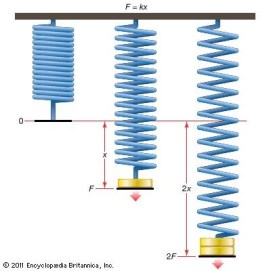
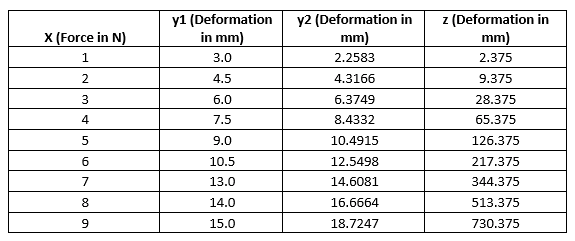
This experiment investigated how Hooke’s law applies to the elasticity of 3 different materials (referred to as Y1, Y2 and Z after their deformation). This involved studying 2 materials in their elastic region and 1 material which has gone past its elastic limit. I included graphs of the data collected as a visual representation of the relationships the data formed; this determined which materials complied with Hooke’s law.

It was found that any material still in its elastic region displayed a positive linear relationship graphically; therefore, Hooke’s law was applied to those materials (as force was proportional to length).

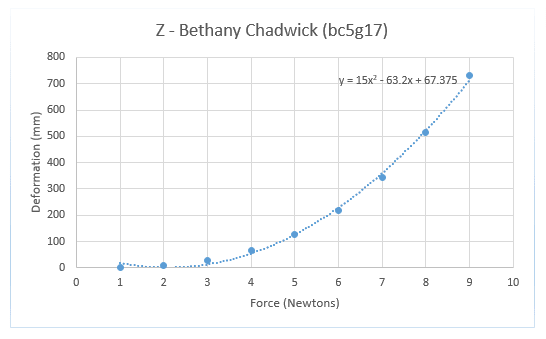
However, materials which had gone past the limit of proportionality did not coincide with Hooke’s law as they did not display a positive linear relationship.

THEORY:

Spring

Robert Hooke discovered that force was proportional to the extension of a spring in 1676, this could be applied to any material as long as it remained within its elastic limit. Hence, the equation was formed; where F = Force, k = spring constant and x = extension of the spring/material.

Consequently, if force F was exerted on the spring, it would extend by x; however if force 2F was exerted on the spring it would extend by 2x. Showing the relationship between the force and length is proportional. This occurs up until the materials elastic limit or otherwise known as its limit of proportionality; after this point the relationship between the force and length is no longer proportional, this is called the plastic region.

GRAPH 1:

y1-and-y2.png

INTERSECT:

Estimate from looking at the graph: x = 2.5

Simultaneous equations:

(1): y= 2.0583x + 0.2

(2): y= 1.5583x +1.375

Solve:

(2) – (1): 0 = 0.5x – 1.175

X = 2.35 N

Substitute x into (1):

Y = (2.0583*2.35) + 0.2

Y = 5.04 mm


Thus, when 2.35 N of force is applied to materials Y1 and Y2; both are ‘stretched’ by 5.04 mm.

Although both the estimated and theoretical values for x are similar, the difference between the values shows that it is important to calculate the intersect using simultaneous equations rather than estimating by viewing the graph.


WHAT IS HAPPENING PHYSICALLY?

Both of the materials in this graph display a positive linear relationship, this coincides with Hooke’s Law; . This means that both materials are still in their elastic regions.

However, as both materials have different gradients (material Y1,  and material Y2, ), when force is applied, material Y2 deforms faster than Y1.

Furthermore, initially Y1 has a higher deformation than Y2 (up until the intersection). Inferring that when an initial force is applied to material Y1 it deforms more than Y2, despite this, Y1 has a much slower rate of deformation and therefore does not ‘stretch’ as fast as material Y2.

GRAPH 2:

Z

WHAT IS HAPPENING PHYSICALLY?

The graph displays a positive relationship, this means that as the force increases so does the deformation of material Z.

On the other hand, the data dos not display a linear relationship but rather a polynomial. Therefore, the force is no longer proportional to the length and the material has entered its elastic region (which no longer abides by Hooke’s law).

EVALUATION OF RESULTS:

DIFFERENCE BETWEEN THE GRAPHS:

Both graphs display that there is a positive relationship between Force and extension of a material. This means that as Force increases so does the extension of the material.

However, graph 1 displays a linear relationship, whereas graph 2 displays a polynomial relationship. Therefore, the materials Y1 and Y2 (as displayed on graph 1) abide by Hooke’s law and are still within their elastic limit, whilst material Z (as displayed on graph 2) no longer abides by Hooke’s law and has entered its plastic region.

Another key difference between the two graphs is the amount of deformation that occurs as a result of 9 N of force being applied to all three materials. Material Y1 displays 15 mm of deformation, material Y2 displays 19 mm of deformation whilst material Z displays around 725 mm of deformation. This suggests that materials only stay in their elastic region if their deformation is low.

ESTIMATION OF ERRORS:

  1. The amount of deformation in mm may have been misread (human error)
  2. The calibration of the equipment may not be completely accurate
  3. There is an outlier in material Y1 (7 N, 13 mm) this could have been avoided if 3 or more trials were taken of the same material with the repeated forces and the average deformation in mm used.

SUMMARY:

Overall, Graph 1 displays two materials, Y1 and Y2, who coincide with Hooke’s law as they display a positive linear relationship, thus force is proportional to extension. However Graph 2 displays material Z which has surpassed its elastic limit. This is displayed by it polynomial relationship (rather than linear) which suggests that force is no longer proportional to length. The experiment could be improved by completing more trials on the materials and the average being used. This would reduce the number of outliers and provide results which are more trustworthy.

REFERENCES:

Bolton, W. (2006). Mechanical Science Third Edition. Oxford: Blackwell Publishing Ltd. Pg 28-29.

Bird, J. Ross, C. (2015). Mechanical Engineering Principles. Oxon: Routledge. Pg 52-53.

Adam-Day, S. (2018). A level notes: Hooke’s Law. [Online]. Available at: https://www.alevelnotes.com/notes/physics/materials/hooke%27s-law [accessed 13/11/2018]

Khan Academy. (2018). What is Hooke’s Law? [Online]. Available at: https://www.khanacademy.org/science/physics/work-and-energy/hookes-law/a/what-is-hookes-law [accessed 13/11/2018]

A-Level Physics. (2018). Hooke’s Law. [Online]. Available at: https://alevelphysics.co.uk/notes/hookes-law/ [accessed 14/11/2018]

Williams, M. (2015). [Online]. Available at: https://www.universetoday.com/55027/hookes-law/ [accessed 14/11/2018]

Image 1. (2018) [online]. Available at: http://media-1.web.britannica.com/eb-media/82/146782-004-1CD38EA0.jpg [accessed 14/11/2018]